Home - Misc.: EV Sales
[Note added 26 November 2021: As discussed below, toward the end of 2019 automakers began to make it harder and harder for InsideEVs to ferret out the sales of individual models in the USA. Though they continued to try, after the end of that year they had to give up their very popular all-models sales updates, from which I drew most of the numbers for this tracker webpage. Some automakers do continue to break out sales of their plug-in models, but few of the biggest sellers are so courteous, and so rather than post a threadbare partial list for 2020 and beyond, I will just freeze this webpage as of the end of 2019. You may take it as a synopsis of the rebirth and rise of modern electric vehicles, "The Triumph of the Electric Car" as I sometimes refer to it. Fuel-cell vehicles (FCVs) are still few enough that I can collect their statistics on my own, so I will continue the section at the bottom of this page as a new tracker webpage just for FCVs.]
I will update this webpage every calendar quarter to keep track of the rapidly growing number of plug-in vehicles appearing on U.S. roads (updated to the fourth quarter of 2019). The hard work of collecting the data is done by InsideEVs; they research sales for each individual vehicle available in the United States, and all I have done here is to sum these into cumulative totals and extract other statistics like market share. Their tables start with the introduction of the Chevrolet Volt and Nissan LEAF in December 2010; in addition, they estimate that from 2008 through 2010 there were 1900 Tesla Roadsters, 1700 Fisker Karmas, 550 Ford Transit Connects, 124 McLaren P1s, and 117 CODAs put on the road, plus smaller numbers of other vehicles. Through late 2019 they provided estimates every month, but many automakers have shifted from monthly reporting of sales to quarterly, and in general they are releasing less detail so that InsideEVs has to dig harder and harder. I'll continue posting these summaries of whatever they are able to put together!
I think of this time period, 2008 to the present, as the Revenge of the Electric Car era. Contrast the numbers on the charts below with the numbers of vehicles built during the Who Killed the Electric Car? era, approximately 1996-2003: about 1500 Toyota RAV4-EVs, 1100 GM EV1s, and a few hundred Honda EV Pluses, Nissan Altras, and others. Note that these data do not break out the fraction of each vehicle that were sold vs. the fraction that were leased; some vehicles, including most of those from the earlier era, were or are only offered for lease. This means that the automakers could stop making them, stop renewing leases, and drop them down the Memory Hole when it suited their agenda. I also don't show any indication of those vehicles that were or are only available in California and maybe a few other states, which are often the same as the lease-only vehicles.
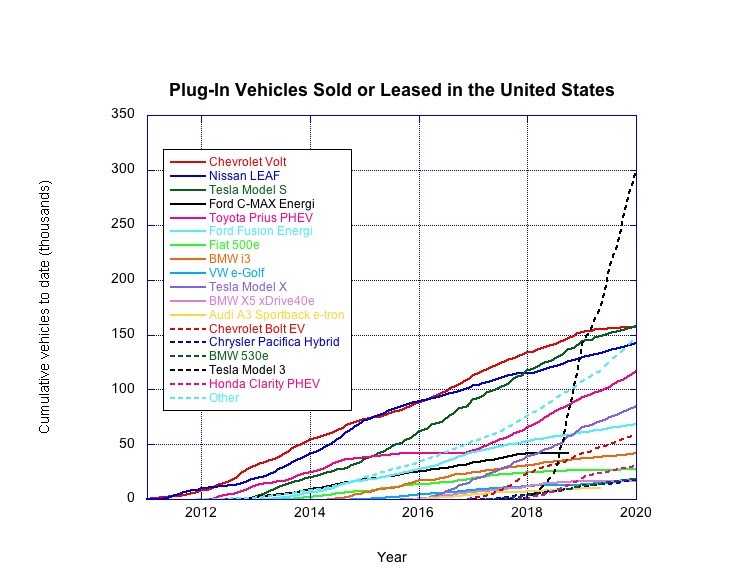
The chart above shows totals for those models that have crossed the 10,000 vehicle threshold. The InsideEVs webpage discusses sales trends, for example slowdowns and speedups before and after the introduction of a new generation of some models; I'll refer you to them for their excellent analyses. Note, however, that there is no obvious crash of plug-in vehicle sales during the recent substantial decline in gas prices; in particular, note the accelerating upward trend of the "Other" line, as more and more different models are introduced by automakers and purchased by drivers. Also, it is of interest that none of these most popular plug-in vehicles are lease-only, and all but the Fiat 500e and VW e-Golf are available nationwide.
The four cumulative sales leaders, the Chevrolet Volt, Nissan LEAF, and Tesla Model S and 3, are a plug-in hybrid (PHEV) and three battery-only electric vehicles respectively, and there is a good mix of both types of vehicle throughout the chart. Until the Model 3 started rocketing up the charts, neither type had a dramatic advantage in the market, despite all the hand-wringing about "range anxiety" for battery-only vehicles (mostly by people who have never driven an EV, or who want to sell you something else).
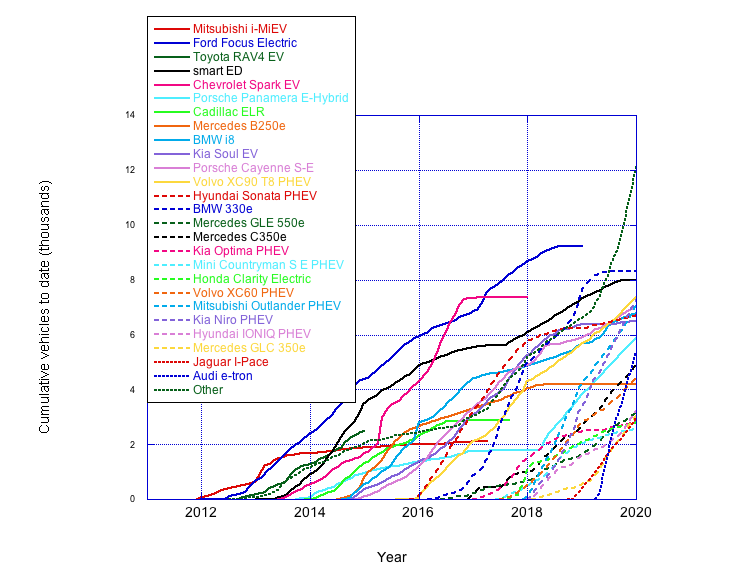
This chart breaks down the "Other" curve in the previous plot. It includes vehicles with limited availability (including lease-only), high-end luxury vehicles, vehicles just getting started in the market, and some that simply didn't catch on over time like the Mitsubishi i-MiEV (which was based on the Mitsubishi "i", a micro-car sold in Japan with a 0.66 liter engine, and which may have been just a little remote from American tastes...). There are getting to be so many models that I ran out of space to plot and label all of them; the "Other" curve in this plot sums up models with fewer than 2000 vehicles sold or leased in the USA to date.
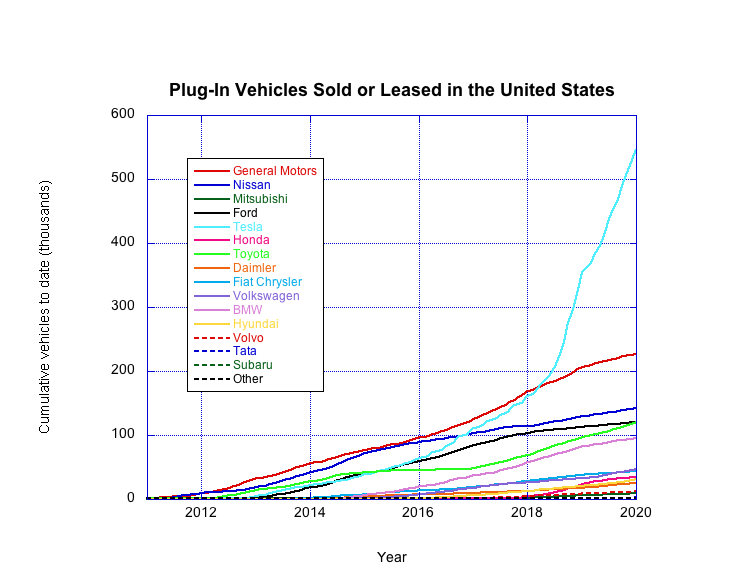
Here is another way to look at the above numbers, combining sales and leases of all vehicles made by the same manufacturer. GM's early lead was mostly due to the chart-topping Chevrolet Volt, which was the first plug-in vehicle to exceed 100,000 cumulative sales and leases in the United States in July 2016, and now the Chevrolet Bolt EV has taken over the task of maintaining that pace. Nissan has only the LEAF in the running, and with two hot-selling vehicles, the Model S and Model X, Tesla overtook Nissan in November 2016 in cumulative sales; adding the Model 3 in late 2017, Tesla overtook GM in March 2018. Ford settled in fourth place with two early PHEV models, the Fusion Energi and C-MAX Energi, after Toyota stopped making their PHEV Prius in 2015; they are rapidly making up ground with the aggressively-priced Prius Prime that was introduced in late 2016.
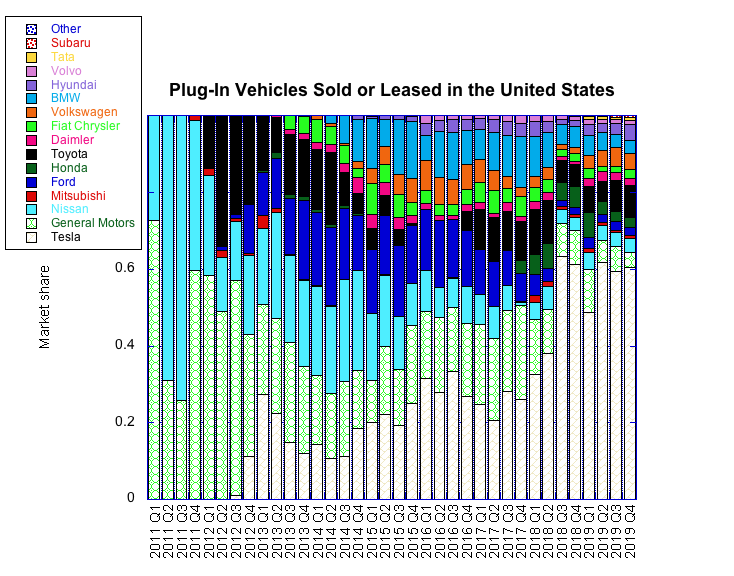
All of the other charts on this webpage show cumulative vehicles sold or leased up to a given date; this figure and the next one plot results for a single quarter. These are the market shares (adding to 100%, or 1.0) of the various manufacturers producing plug-in vehicles for the U.S. market. The recent trend shows Tesla increasingly dominant, reaching market share levels nobody had achieved since 2011, when there were only GM and Nissan dividing up the market. Starting in July 2018, their Model 3 alone has matched or even outsold all plug-in vehicles from all automakers besides Tesla combined, and starting in December 2018 it frequently exceeds the sum of all others including the Tesla Models S and X!
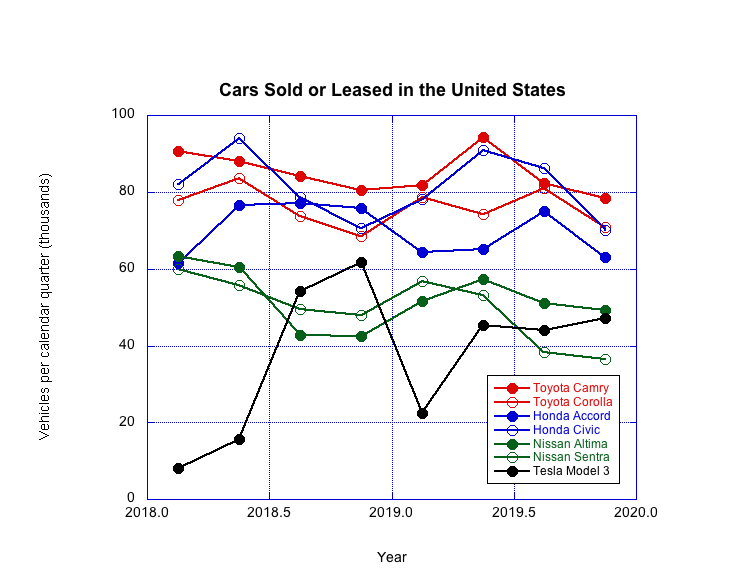
It's clear from the chart at top that the Tesla Model 3 is really in a class by itself with regard to popularity among plug-in vehicles. Quite a few models have achieved respectable sales numbers over the period shown in that chart, but only the Model 3 can truly be said to have become a "mainstream" vehicle. This figure shows how its quarterly deliveries starting in 2018 compare with those of the most popular cars in the United States, all of which are significantly less expensive than the Model 3. It frequently bests the usual number 5 and 6 Nissan vehicles, and in a couple of months it has challenged the Toyota Corolla or Honda Accord for 4th place!
Note added 19 November 2016: Less than three days after the 2016 election, the Alliance of Automobile Manufacturers (AAM) took advantage of the shifting winds to petition the new President-elect to roll back fuel economy and emissions limits and, worse, to work with Congress to strip the California Air Resources Board (CARB) of its ability to set limits stricter than the federal ones. Every major automaker that has made plug-in vehicles for the U.S. market is a member of AAM except Nissan, Honda, Kia, Hyundai, and of course Tesla. This means that even as these automakers are rolling out new and improved EVs and PHEVs, out of the other side of their mouths they are complaining about how difficult and uneconomical they are to build.
With the number of plug-in vehicles on the road in the U.S. a hundred times larger than a decade and a half ago, and with acclaim such as the new Chevrolet Bolt EV being declared the Motor Trend 2017 Car of the Year, one can hope that the horse has escaped the barn; one can also hope that automakers are smart enough to realize that the rest of the world is not in the grip of global-warming denial, and they will want to continue building plug-in vehicles if only to sell them overseas. However, those of us with the perspective of fifteen to twenty years will be watching to sound the alarm if automakers decide again that successfully building and selling plug-in vehicles undermines their attempts to obtain weakened pollution regulations. We have seen this movie before, and the ending wasn't happy.
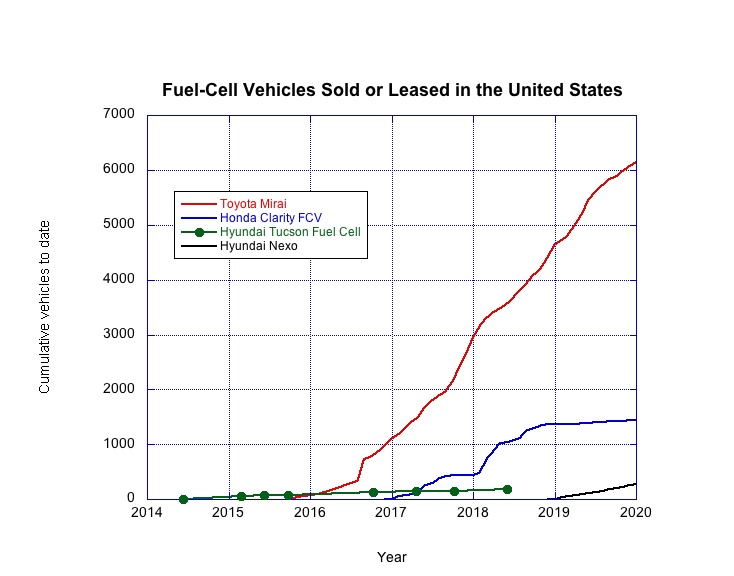
Automakers have made great promises about fuel-cell vehicles (FCVs) since around 2000, and as of 2014/2015 a few began to be leased in more-than-prototype numbers, and even sold outright in the case of the Toyota Mirai. InsideEVs sometimes remarks on sales/lease numbers for the Mirai, and also the Honda Clarity FCV and the Hyundai Nexo, but doesn't track them, so I'll provide tables of monthly (through 2019) or quarterly data here for those vehicles. The earliest FCV on this plot, the Hyundai Tucson Fuel Cell, was also available (for lease only) "in limited ZIP Codes" in the United States, and though Hyundai didn't release monthly data I tracked down a few cumulative numbers (green dots in the figure) from press releases like this one announcing the first U.S. delivery in 2014.
|
2019 |
Jan |
Feb |
Mar |
Apr |
May |
Jun |
Jul |
Aug |
Sep |
Oct |
Nov |
Dec |
Year to Date |
All Years |
|---|---|---|---|---|---|---|---|---|---|---|---|---|---|---|
|
Toyota Mirai |
77 |
94 |
176 |
202 |
248 |
166 |
126 |
98 |
62 |
89 |
98 |
66 |
1502 |
6146 |
|
Honda Clarity FCV |
1 |
0 |
13 |
10 |
8 |
10 |
5 |
9 |
5 |
5 |
5 |
5 |
76 |
1439 |
|
Hyundai Nexo |
35 |
5 |
20 |
19 |
19 |
21 |
21 |
34 |
23 |
17 |
38 |
15 |
267 |
275 |
|
2018 |
Jan |
Feb |
Mar |
Apr |
May |
Jun |
Jul |
Aug |
Sep |
Oct |
Nov |
Dec |
Year to Date |
All Years |
|---|---|---|---|---|---|---|---|---|---|---|---|---|---|---|
|
Toyota Mirai |
213 |
166 |
83 |
76 |
102 |
103 |
137 |
116 |
159 |
119 |
194 |
232 |
1700 |
4644 |
|
Honda Clarity FCV |
56 |
243 |
121 |
156 |
30 |
35 |
55 |
119 |
50 |
49 |
9 |
1 |
924 |
1363 |
|
Hyundai Nexo |
8 |
8 |
8 |
|
2017 |
Jan |
Feb |
Mar |
Apr |
May |
Jun |
Jul |
Aug |
Sep |
Oct |
Nov |
Dec |
Year to Date |
All Years |
|---|---|---|---|---|---|---|---|---|---|---|---|---|---|---|
|
Toyota Mirai |
83 |
110 |
118 |
106 |
162 |
129 |
82 |
70 |
184 |
249 |
249 |
296 |
1838 |
2944 |
|
Honda Clarity FCV |
42 |
27 |
23 |
34 |
119 |
49 |
82 |
41 |
14 |
0 |
0 |
0 |
431 |
439 |
|
2016 |
Jan |
Feb |
Mar |
Apr |
May |
Jun |
Jul |
Aug |
Sep |
Oct |
Nov |
Dec |
Year |
All Years |
|---|---|---|---|---|---|---|---|---|---|---|---|---|---|---|
|
Toyota Mirai |
26 |
30 |
41 |
41 |
40 |
40 |
52 |
371 |
69 |
103 |
105 |
116 |
1034 |
1106 |
|
Honda Clarity FCV |
8 |
8 |
8 |
|
2015 |
Jan |
Feb |
Mar |
Apr |
May |
Jun |
Jul |
Aug |
Sep |
Oct |
Nov |
Dec |
Year |
|---|---|---|---|---|---|---|---|---|---|---|---|---|---|
|
Toyota Mirai |
34 |
23 |
15 |
72 |
 Back
to Fueling Station
Back
to Fueling Station Site
Map
Site
Map Contact
Me
Contact
Me
![]()
![]()
All content copyright 1998-2026 by Mark Looper, except as noted. Reuse of my copyrighted material is authorized under Creative Commons Attribution 4.0 International license (CC BY 4.0).
![]()
![]()
new 1 May 2016, updated 27 November 2021