Home - Misc.: PV System
I dedicate this webpage to the memory of William Korthof (1978-2014), who was a leader by idea and by action in the fight to get electric vehicles on roads and solar cells on roofs. I first met him at the Malibu Road Rally of the EV1 Club in 1999; I regret that I did not get to know him better while I had the opportunity. He was an inspiration to many during his too-brief life.
This webpage is a summary of our first ten years of experience with a grid-connected residential photovoltaic (PV, or solar electric) system, consisting of SunPower panels installed by RevoluSun. The numbers are specific to our installation, which is on the roof of a house on the windward side of the island of Oahu in Hawaii, and which is subject to the net metering rules of the Hawaiian Electric Company, our local electrical utility. However, I will try to make the discussion both general enough and detailed enough to be of use to anybody who is considering putting solar cells on his or her roof. I posted the first version of this webpage with two years of data, and I updated it with each new full year of data. With multiple years of measurements, you can see not only how the output varies over the seasons of a year but also how it can vary from year to year for a typical system like ours. In spring of 2023, we added more PV panels plus battery storage to our system, which changes the system's behavior quite a bit; I will post a new webpage to resume tracking when I have the first year of data with the upgraded system.
First, a few definitions:
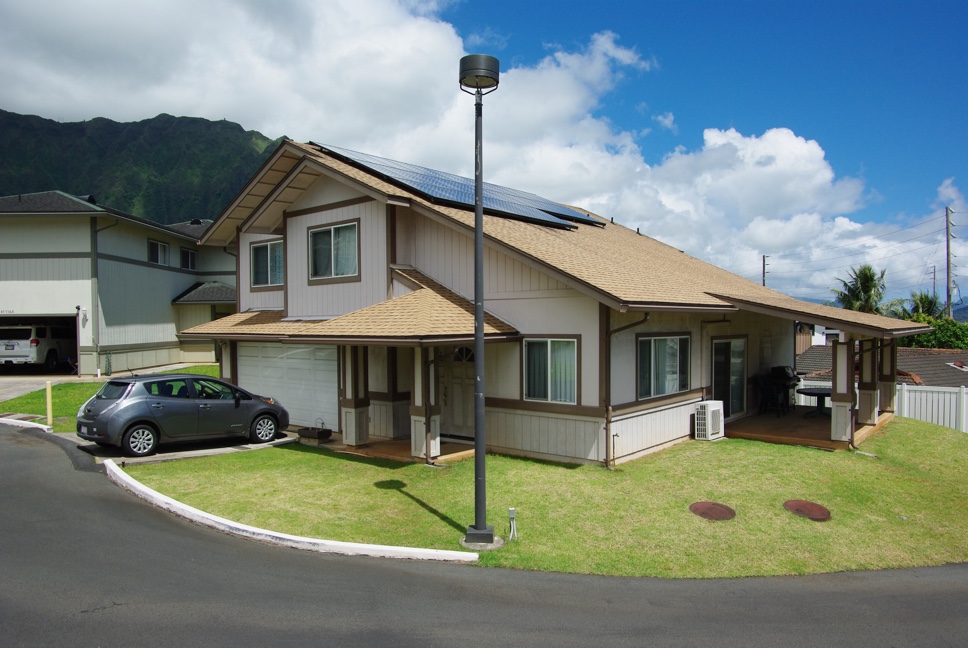
So how does this apply to a real world installation? Well, to begin with, an individual solar panel or an entire installed set of panels is rated by its peak output: that is, this is the power that the panel or installation would produce on a cloudless day with the sun directly over the panel(s). For example, our installation has 47 SunPower panels (you can see about half of them in the photo at the top of this page), each rated at 210 watts peak output, for a total system rating of 9.87 kilowatts. However, of course the panels and the system do not produce this much power all day, even on a clear day. It is possible to mount solar panels on a tilting mount that tracks the sun, keeping them face on to the sun so they produce as much power as possible all day, but that's a lot of bulk and moving parts and is very uncommon in residential installations. Without this, the sun shines obliquely on the panels during most or all of the day, and thus the system produces less than the rated maximum power most of the time.
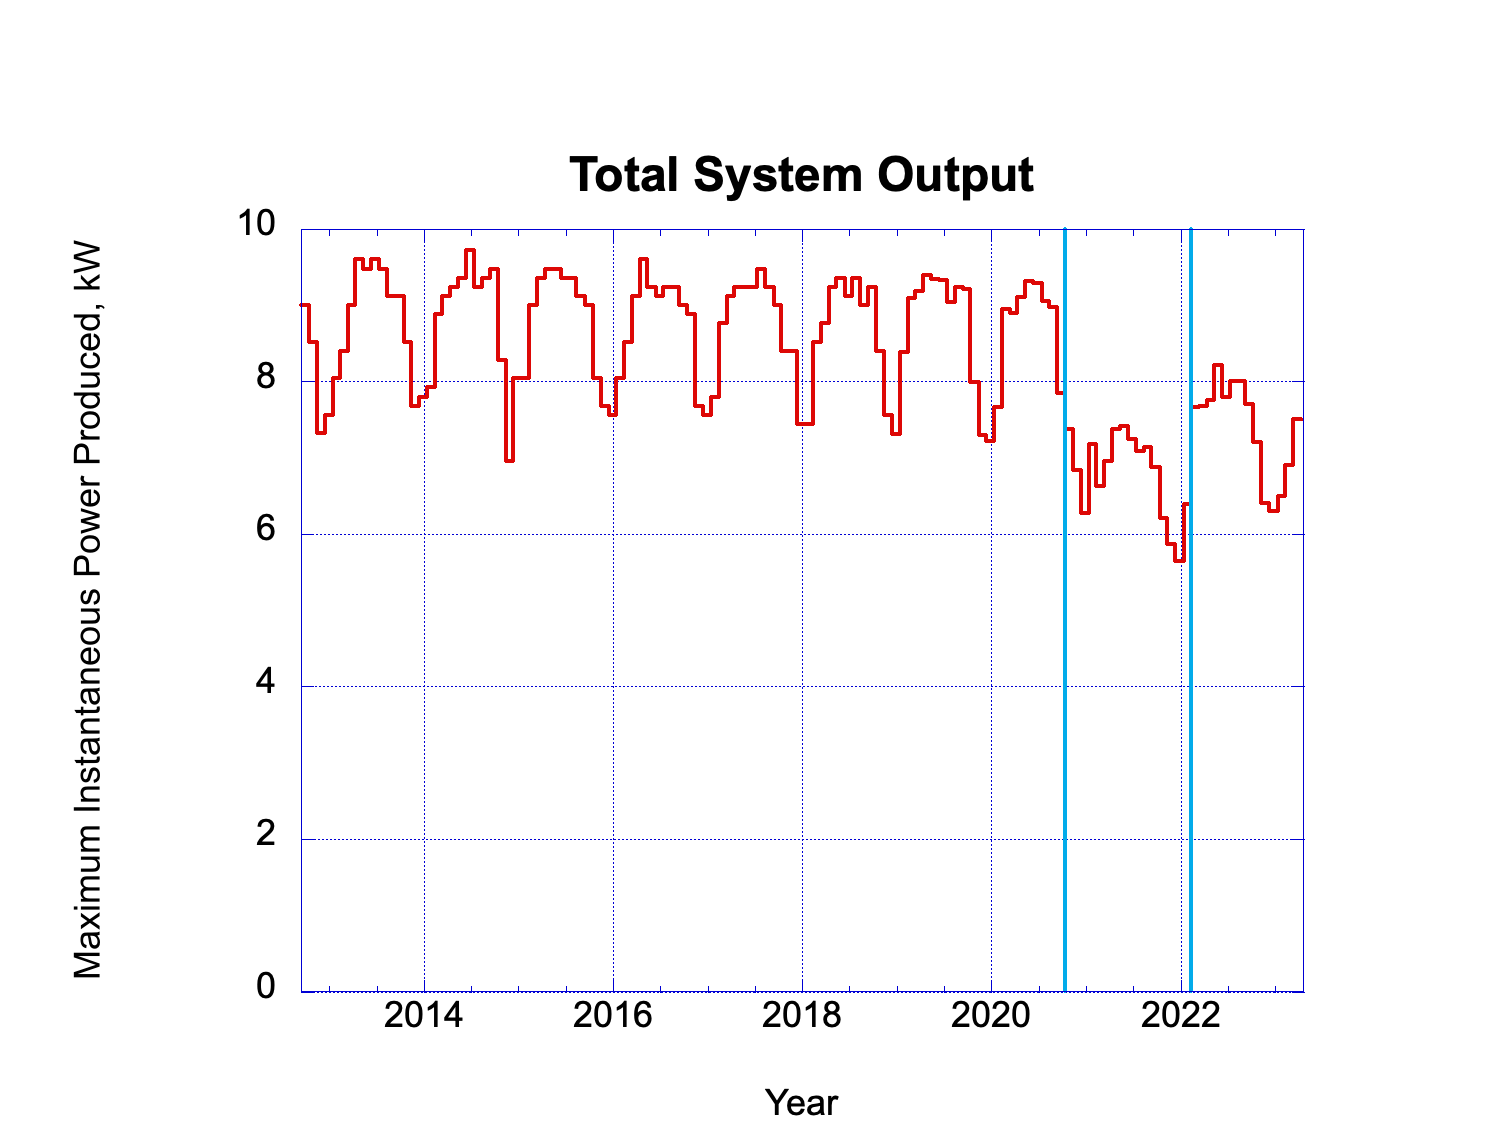
The sun will be higher in the sky at noon during summer than during winter, so depending on the angle of the panels relative to the average path of the sun, the sun will never be directly over the panels at any time of day during some seasons. Thus the maximum instantaneous output can never reach the rated value of the system at all during these seasons. This effect is shown in the figure above, for our house, which shows the greatest output from the system in kW during the best recorded time period in each entire month (five-minute averages until late 2020, fifteen minutes thereafter).
You can see that there is not a huge variation here over the course of a year except for the last couple of years, after the first light blue vertical line, when one of our four inverters that turn DC photovoltaic power into AC household power failed. Fortunately, we got it replaced under warranty; unfortunately, the failure occurred shortly after I had collected the data for the eighth year, and the system has been so reliable that I had gotten out of the habit of looking at the inverters' status lights, so I didn't discover the problem until I was collecting the data to summarize the ninth year. Likewise, only as I was gathering data to make this plot for the tenth year did I realize that the output hadn't come completely back to normal after the inverter was replaced (at the second light blue vertical line), so the peak-power curve is still a little low. I'll have to see if our installer can figure out what is still amiss.
How this annual variation will play out in other installations will depend on the angle and orientation of your roof, and on your latitude (i.e., how high the sun gets in the sky at noon during any given season). Our roof's main slopes face east and west; ideally one would install panels on a roof slope that faces toward the south (in the northern hemisphere), since the sun is southeast, south, or southwest of the house all day. Since we live just inside the tropics in Hawaii, though, the sun passes directly overhead and even slightly to the north for a few days in summer, and is never very far down in the sky at noon even during winter. Thus the lack of south-facing slopes on our roof is less of a problem than it would be at higher latitudes.
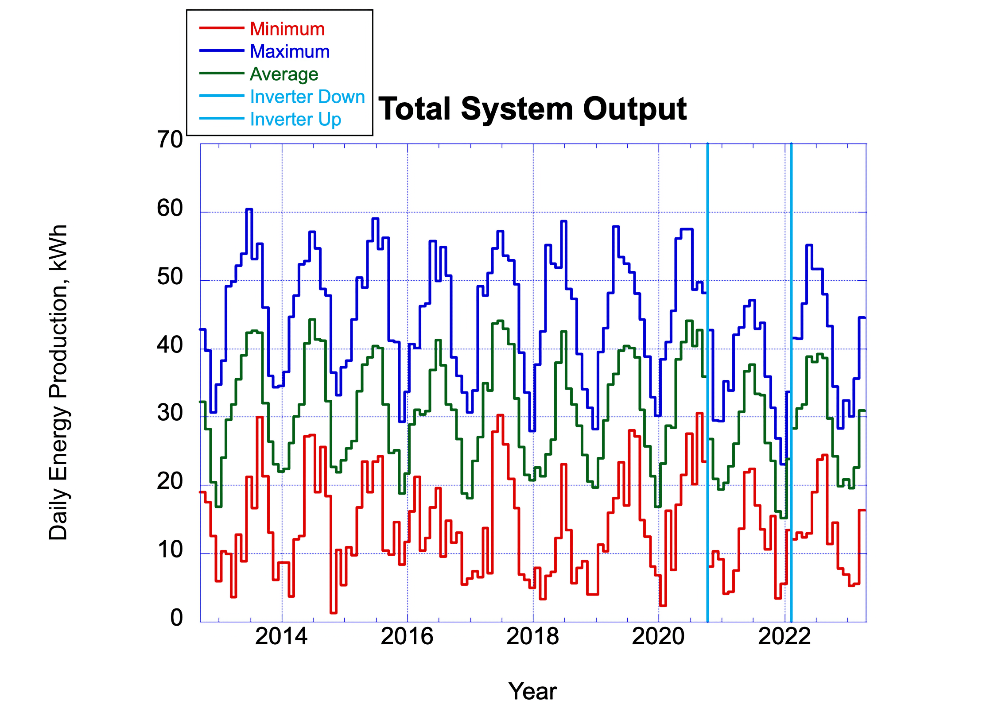
Of course, other circumstances besides the maximum altitude of the sun affect how much energy a PV system will generate each day, namely the length of day and the weather. The length of day, and how it varies over the course of a year, will depend on your latitude, while the weather at your particular location will determine how often your power production is reduced by cloud cover between your system and the sun. The figure above shows how this worked out over ten years, for our house. The curves plotted are the maximum and minimum energy in kWh produced during any day in the given month, and the average for all days in the month.
Ideally, if we had at least one completely clear day each month, the uppermost curve would smoothly track the variation of length of day and altitude of sun over the year. On the windward side of an island in the tropics, though, we don't get completely clear days very often, so there is some effect of weather folded into that curve. The other curves show more fully the effects of weather at our location: you'll note that some of the lowest minimum daily production values (as well as the biggest spreads between maximum and minimum production within a month) are not only in December, when the day is shortest and the sun is lowest, but also toward spring when we get even more clouds than usual. And again, between the light blue vertical lines there is a step down after the inverter failed.Your PV installer has detailed computer programs to tell how all these variables, as well as the angles of your roof, shadowing from trees or mountains, etc., will affect the amount of energy your system can be expected to produce each year. For example, simply relocating our system from where we live to the much drier southwest corner of the island, with essentially the same altitude of sun and length of day, would let it produce about a third more energy in the course of a year just because of the clearer skies. The exact amount of energy your system produces in any given year, of course, will depend on what the weather does that year. Our installer predicted that our system would produce 12953 kWh per year given average weather conditions, and the actual figure for each of the first eight complete years (before the inverter failure) was between 10% and 20% lower than that.
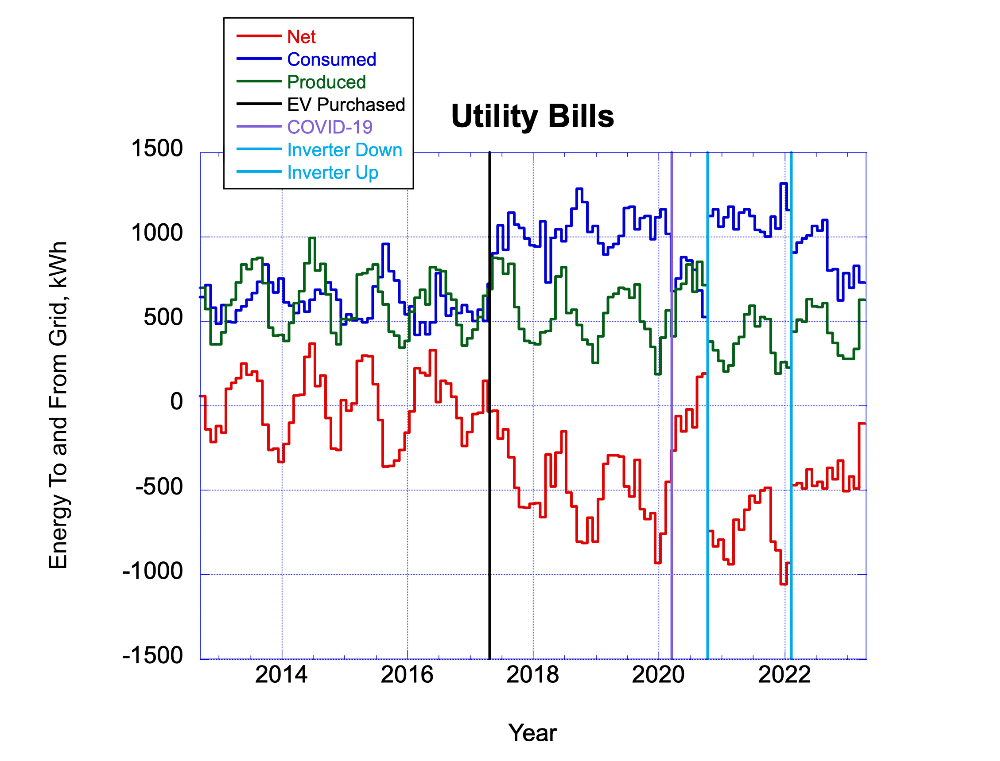
The whole point of net metering is to bring down one's electrical bills, so how has that played out? The electric company does not directly see either the amount of energy produced by our PV system (the two figures above labeled "Total System Output" are from data provided by our manufacturer, SunPower, which gives customers an Internet-based monitoring service) or the amount of energy consumed by our house. Rather, the utility company measures the power actually flowing to or from their grid at any moment, which is a balance between the instantaneous production from our PV system and consumption by our house. This figure shows the total energy we put into the grid each month (labeled "Produced"), the total we drew from the grid ("Consumed"), and the difference ("Net").
In months where the red curve is above zero our PV system produced more energy than we used, so we just paid a nominal minimum bill of about $20, which is a pretty nice drop from what we had been paying before we installed the system. On top of that, the electric company credited us with the dollar value of the excess electrical energy we sent them, an amount that as far as I can tell includes all the taxes, surcharges, etc., except for the monthly customer charge and a small "Green Infrastructure Fee." That credit is accumulated for up to a year from the anniversary of our installation (the start of the charts in the above figures, mid-September 2012), and in any month where the red curve dips below zero the credit is tapped before we have to write a check for the excess electrical energy we drew from the grid above the amount we put in.
You'll note that there is a big step up in the blue "Consumed" curve, and a consequent drop in the red "Net" curve, at the vertical black line in April 2017. That's because on Earth Day, April 22, we bought an electric car, a Nissan LEAF (in the driveway in photo at top). My wife used it for her daily commute during most of the time since then, so it was charged at night; I worked from home through this whole period, so if it was "my" vehicle and I could charge it during the day there would have been a step down in the green "Produced" curve instead, but the same effect on the red "Net" curve. Don't let this dissuade you from considering an electric vehicle (EV), though; the only reason it made such a big difference in our electricity usage (from the point of view of the utility) is that we were already pretty much in balance over a year's variations between the consumption of our house and the production of our PV system, so the EV's usage is a large fraction of the residual difference. If we didn't have PV reducing our utility usage by so much, the effect of adding an EV would not have been nearly so noticeable, about a 25% boost. And in any case, it's cheaper than gasoline!
The purple vertical line shows where our electricity use for driving went down again as the COVID-19 lockdown began, so that we no longer had to drive the kids to and from school and my wife joined me in telecommuting. Our air conditioner also broke down shortly after that, further reducing our electricity use, so that our net production rose above zero for the first time since we bought the EV. Then, as noted above, between the light blue vertical lines one inverter failed and cut our production. There are further yearly fluctuations when our kids' school transportation needs changed, after we got the air conditioner fixed and the inverter replaced, etc.; we'll see if the next few years settle down a bit!
Again, these details apply to a particular system at a particular location, subject to a particular set of net metering rules; PV installers near where you live can tell you what to expect given your own roof and utility company, but I hope that this webpage will at least give you a starting point from which to ask questions of them. (And of course, I haven't even mentioned installation prices, let alone tax credits, rebates, etc., all of which will vary dramatically from place to place and year to year.) Anyway, if you happen to be within the service territory of RevoluSun, I can recommend them for good value, communication, and service. They were not the cheapest vendor with whom we spoke, but they weren't that much more expensive; and my father-in-law, who is an architect, liked the way that they handled the water sealing of the locations where they have to penetrate the roof to install the racks and the wiring, which is kind of a big deal on the wet side of the island. The links on this page are not "affiliate" links, but if you want to use the "Contact Me" button at the bottom of the page for more discussion and you end up going with RevoluSun (or with SunPower panels, from RevoluSun or another installer), there is a pretty sweet referral bonus that I'd be grateful if you'd tell them to send my way...
 Back
to Fueling Station
Back
to Fueling Station Site
Map
Site
Map Contact
Me
Contact
Me
![]()
![]()
All content copyright 1998-2026 by Mark Looper, except as noted. Reuse of my copyrighted material is authorized under Creative Commons Attribution 4.0 International license (CC BY 4.0).
![]()
![]()
new 31 May 2015, updated 4 September 2023